
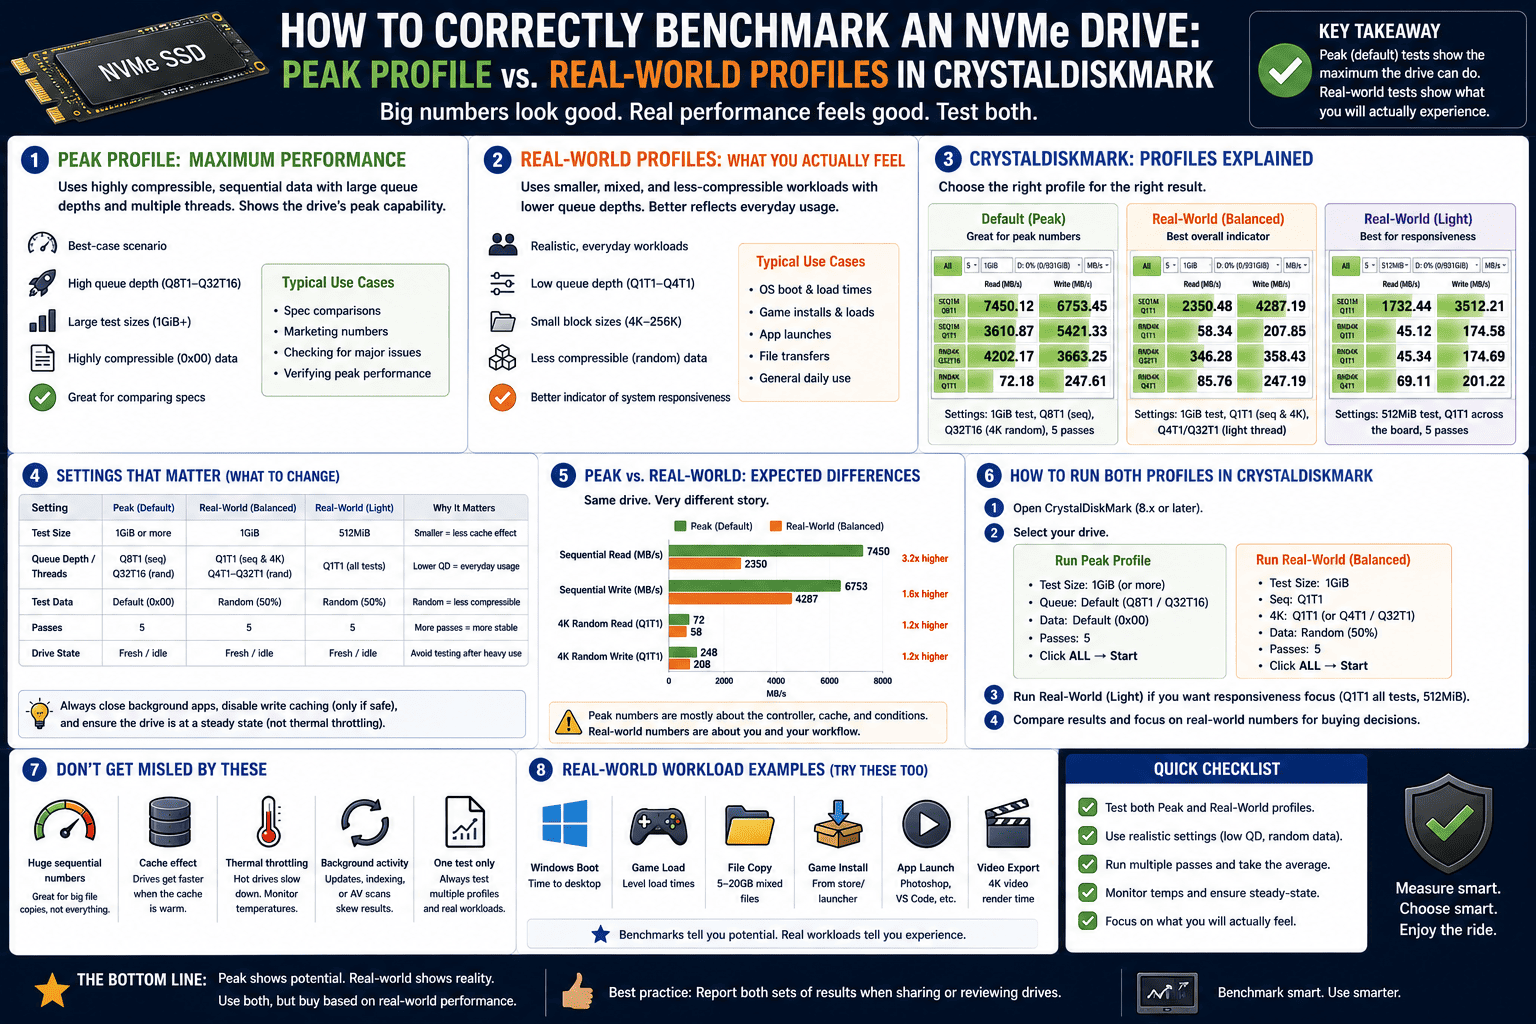
How to Correctly Benchmark an NVMe Drive: Peak Profile vs. Real-World Profiles in CrystalDiskMark
Go to any PC hardware forum, tech subreddit, or Discord server, and you will inevitably run into the exact same post. A user uploads a screenshot of their brand-new, premium NVMe drive, alongside a frustrated caption: “Why is my drive so slow? The box says 14,000 MB/s, but I’m only getting a fraction of that!”
Nine times out of ten, the drive isn’t defective, the motherboard isn’t broken, and the user hasn’t been scammed. The reality is simple: they ran the benchmark incorrectly.
CrystalDiskMark is the global standard for testing storage performance, but it is a precision instrument. If you just open the app and smash the “All” button without adjusting your configurations, you will likely get data that doesn’t match your drive’s advertised speeds.
To help you benchmark your SSD accurately, let’s break down the optimal CrystalDiskMark profile settings and explain why understanding sequential read vs. random read 4K tests is the secret to uncovering your drive’s true performance.
The Box Speed Illusion: Decoding Sequential 1MiB (Q8T1)
When a brand like Samsung or Corsair prints a massive speed rating on the front of the box (e.g., Up to 14,500 MB/s!), they are talking about Sequential Burst Speeds.
Sequential data refers to massive, unbroken blocks of files stored next to each other on the drive—think of it like copying a massive, single 100GB zip file or streaming a raw 8K video file.
To hit those maximum advertised limits in CrystalDiskMark, the software defaults to a specific testing profile: SEQ1M Q8T1.
-
SEQ1M: The test uses large 1 Mebibyte blocks of data.
-
Q8T1 (Queue 8, Thread 1): The software gives the drive’s controller a line of 8 tasks to complete sequentially, processing them on a single CPU thread.
Because the data blocks are massive and perfectly organized, the drive’s internal controller can operate at absolute peak efficiency. This is a “best-case scenario” test. If your goal is to verify that your new PCIe Gen 5 drive is properly configured in the BIOS and hitting its maximum theoretical limits, you must run this peak profile.
The Real-World Reality: Decoding Random 4KiB (Q1T1)
Here is the hard truth: outside of copying massive movie files, your operating system almost never handles sequential data.
Windows, web browsers, and video games operate by reading and writing thousands of tiny, completely scattered files all over the drive simultaneously. When you launch a game, load a webpage, or boot up your PC, your storage drive is fetching thousands of separate 4 Kilobyte (4KiB) files.
To see how your drive performs in daily use, look at the bottom row of your benchmark results: RND4K Q1T1.
-
RND4K: The test uses tiny 4 Kilobyte blocks of data scattered across the silicon chips.
-
Q1T1 (Queue 1, Thread 1): The software sends a single file request, waits for the drive to find it, fetches it, and only then sends the next request. There is no queue to help the drive plan ahead.
When you run a Random 4K test, that blazing-fast 14,000 MB/s Gen 5 drive will suddenly report speeds around 80 MB/s to 115 MB/s.
Don’t panic. This drop is completely normal. Because the controller has to constantly search the physical flash cells for scattered pieces of data without a queue backup, it encounters latency. The Random 4K Q1T1 metric is the single most accurate reflection of how “snappy” your PC will actually feel during daily multitasking.
Step-by-Step Guide: How to Configure CrystalDiskMark Correctly
To stop getting inaccurate readouts and properly evaluate your storage hardware, follow this configuration guide:
Profile 1: The “Verification” Test (To Hit Box Speeds)
Use this setup if you want to verify your drive isn’t defective and is successfully hitting its maximum advertised bandwidth.
-
Open CrystalDiskMark.
-
Navigate to the top menu bar and click on Settings > Profile.
-
Select Default (or Peak Performance if your manufacturer explicitly lists high-queue benchmarks).
-
Ensure your test size is set to 1 GiB and run the test. Your top row (
SEQ1M) should closely match the speeds advertised on your SSD’s box.
Profile 2: The “Real-World” Test (To Measure Actual Daily Snappiness)
Use this configuration to benchmark how your drive will handle operating system tasks, loading screens, and professional applications.
-
Go to Settings > Profile and select Real World Performance.
-
Notice how the dashboard changes: the high-queue sequential tests disappear, replaced by low-queue tests like SEQ1M Q1T1 and RND4K Q1T1.
-
Run the test. Do not look at the raw numbers expecting thousands of megabytes per second. Instead, compare your
RND4Kscores against other drives online. A drive scoring 100 MB/s here will feel significantly faster responsively than a budget drive scoring 50 MB/s, regardless of what the box speed says.
The Ultimate Benchmarking Checklist
Before you capture your next screenshot to share online, ensure your testing environment is optimized to avoid corrupted data variables:
-
Close Background Apps: Turn off Steam downloads, close web browsers, and pause cloud syncing tools. If another app writes data mid-test, your benchmark scores will instantly plunge.
-
Monitor Your Thermals: High-speed NVMe drives generate massive heat during sequential bursts. Keep CrystalDiskInfo open on a secondary monitor while running CrystalDiskMark. If your drive breaches 70°C, the controller will trigger thermal throttling, ruining your benchmark results.
-
Don’t Test a Full Drive: Solid-state memory slows down dramatically once it fills past 80% capacity because the controller struggles to find empty space to clear blocks. For accurate structural testing, benchmark your drive when it has plenty of breathing room.
The Bottom Line
The next time you see someone complaining that their premium NVMe drive is broken because it isn’t hitting 14,000 MB/s in everyday tasks, send them this guide. A fast drive is more than just a massive sequential burst number on a box; it’s a balance of architectural efficiency, low-latency random tracking, and smart configuration layout. Configure your profiles correctly, interpret the data accurately, and get the most out of your hardware!