What is a Good CrystalDiskMark Score for Your SSD? (2026 Guide)
Wondering what a good CrystalDiskMark score is? We break down SEQ1M vs RND4K speeds and provide average benchmark ranges for HDDs, SATA SSDs, and NVMe drives.
Introduction
You just built a new PC or bought a high-end SSD, installed it, and immediately downloaded CrystalDiskMark to test its speed. You click “All” to run the benchmark, and a few minutes later, you are staring at a grid of massive numbers.
While seeing a score of 7,000 MB/s looks incredibly impressive, most users have no idea what these numbers actually mean or if their drive is performing the way it should. What exactly is a good CrystalDiskMark score?
In this comprehensive guide, we will break down exactly how to read your benchmark results, explain the critical difference between Sequential and Random speeds, and give you the average score ranges for every type of drive on the market today.
Understanding the Tests: Sequential vs. Random
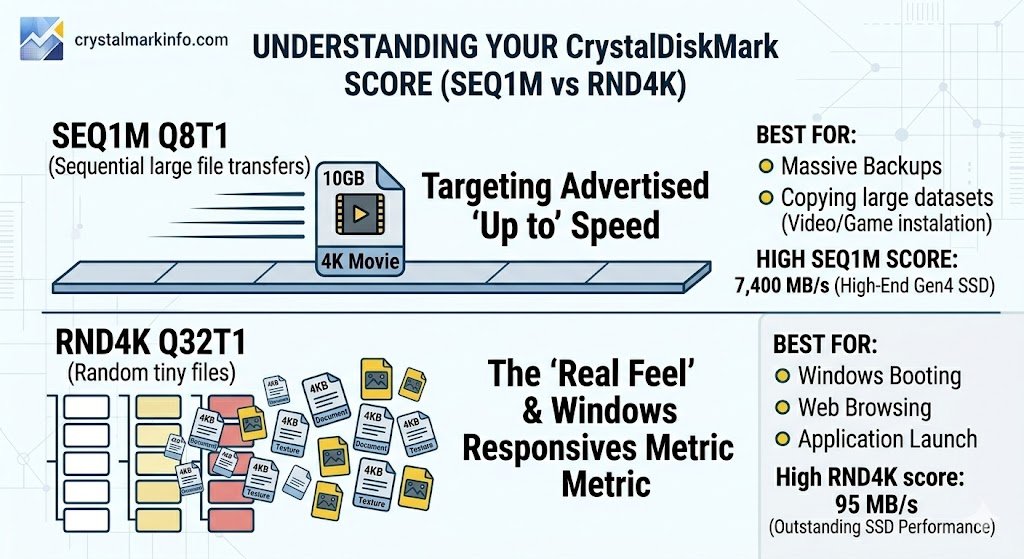
CrystalDiskMark doesn’t just run one test; it simulates different ways your computer actually uses data. To understand your score, you must understand the two main rows on the results screen: SEQ1M and RND4K.
SEQ1M Q8T1 (Sequential Large File Transfers)
The top rows of your benchmark represent Sequential read and write speeds. This tests how fast your drive can move a single, massive file in one continuous block.
-
Real-World Example: Copying a massive 50GB 4K movie file from one folder to another, or downloading a massive zipped game file.
-
The Marketing Metric: When you look at an SSD box and it proudly claims “Speeds up to 7,400 MB/s,” they are advertising the Sequential speed. It looks great on paper, but it is not how your computer operates most of the time.
RND4K Q32T1 (Random Tiny Files)
The bottom rows represent Random 4K read and write speeds. This tests how fast your drive can find and move thousands of tiny, scattered files located all over the storage chips.
-
Real-World Example: Booting up Windows, launching your web browser, or loading a game with thousands of small texture files.
-
The “Feel” Metric: This is the most important score for a snappy, responsive PC. Even the fastest Gen 5 NVMe drives will score dramatically lower here (often under 100 MB/s), but this is the number that dictates how fast your computer actually feels during everyday tasks.
What is a Good CrystalDiskMark Score?
A “good” score depends entirely on the physical hardware you have installed. You cannot compare an old mechanical hard drive to a modern M.2 stick.
Here are the target Sequential (SEQ1M) speed ranges you should expect depending on your storage type:
| Drive Type | Expected Read Speed (MB/s) | Expected Write Speed (MB/s) | Best Used For |
| Traditional SATA HDD | 100 to 250 | 100 to 200 | Mass storage, backups, archives |
| SATA 2.5″ SSD | 500 to 550 | 450 to 530 | Older laptops, budget game drives |
| Gen 3 NVMe M.2 SSD | 3,000 to 3,500 | 2,500 to 3,300 | Excellent everyday performance |
| Gen 4 NVMe M.2 SSD | 5,000 to 7,500 | 4,000 to 6,800 | High-end gaming, video editing |
| Gen 5 NVMe M.2 SSD | 10,000 to 14,000+ | 9,000 to 12,000+ | Extreme enthusiast workloads |
Why is My Score Lower Than the Box Says?
If you bought a Gen 4 NVMe SSD advertised at 7,000 MB/s, but CrystalDiskMark is only showing a score of 3,500 MB/s or less, do not panic. Your drive is likely fine, but it is being limited by one of these common bottlenecks:
-
Motherboard Bottlenecks (PCIe Generations): This is the most common issue. If you plug an ultra-fast Gen 4 SSD into an older motherboard that only supports PCIe Gen 3, the motherboard will limit the drive to Gen 3 speeds (capping it around 3,500 MB/s).
-
Testing Your Boot Drive: If you are benchmarking the exact same drive that Windows is currently running on, your scores will be lower. Windows is constantly reading and writing background files, which interrupts the CrystalDiskMark test.
-
Thermal Throttling: NVMe SSDs get incredibly hot. If your drive does not have a heatsink, it might hit 70°C+ during the benchmark and intentionally slow itself down to prevent melting.
-
“Up To” Marketing Speeds: Manufacturers test their drives in absolutely perfect, laboratory conditions on completely empty drives. A drive that is 80% full will naturally benchmark slightly slower than an empty one.
The Bottom Line
When trying to determine what a good CrystalDiskMark score is, always manage your expectations based on your hardware. If your Sequential speeds are near the advertised limits of your drive’s generation, your hardware is perfectly healthy.
However, remember not to obsess over the massive 7,000+ MB/s sequential numbers. If your computer boots up instantly and applications open without delay, your Random 4K speeds are doing exactly what they need to do.